by admin | Oct 14, 2015 | Market Data
Source: www.corelogic.com
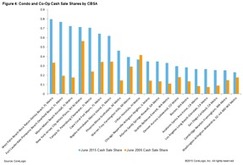
Condominium and co-op mortgage originations nationwide rose 31 percent to $39 billion in the second quarter of 2015 compared with $29.7 billion in the same quarter of the previous year. Vertica Partners believes that one of the keys to solving the housing affordability issue is to provide more condo financing for projects.
The last boom saw a massive condo conversion wave where rental apartments were converted to condos at an unsustainable pace. Because loans were virtually handed out to anyone that could fog a mirror it was not uncommon for “investors” to own dozens of units with little to no skin in the game. The problem wasn’t that condo conversions are necessarily a bad thing, it was the manner in which they were completed and the frenzy that ensued.
When done in an orderly fashion with real lending standards in place, condo conversions could be a viable strategy for those just starting out or empty nesters looking to downsize in well located communities offering maintenance free lifestyles.
by admin | Oct 14, 2015 | Market Data

As the single-family rental space becomes more populated with investors, all of whom are trying to gain any advantage that will help them cut costs and streamline processes, therefore maximizing profits, more of them are turning to technology.
Source: dsnews.com
As the single-family rental space becomes more populated with investors, all of whom are trying to gain any advantage that will help them cut costs and streamline processes, therefore maximizing profits, more of them are turning to technology. Many new technologies have come along just in the last few years to aid single-family rental investors with their business, and technology is expected to play an even more significant role in the SFR market going forward. The industry should see a lot more transaction management software, acquisition management software, and even property and asset management disposition software to help combat the management inefficiencies which have plagued the industry.
by admin | Oct 14, 2015 | Market Data
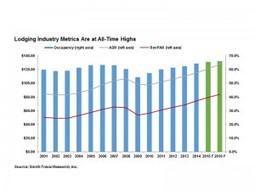
Although lodging fundamentals have remained strong for several years, record occupancy levels and supply coming online indicate the cycle is nearing its end.
Source: www.cpexecutive.com
Lodging occupancy rates reached an all-time high in 2014 at 64.4 percent, and a modest increase of less than 1 percent in 2015. However, new supply expected over the next 12 months may result in occupancy rates reversing course and beginning to decline. ADR will continue to drive RevPAR growth through 2016 as the pipeline for new product is extremely robust in many markets.
by admin | Oct 14, 2015 | Market Data
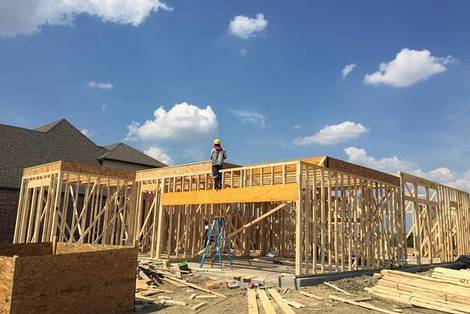
Where did all the construction workers go?
Source: blogs.wsj.com
Home builders are facing delays and rising costs as they struggle to find enough construction workers.
That’s partly a function of the housing boom and bust, which helped push industry-wide employment above 7.7 million in 2006, only to watch it come crashing down by nearly 2.3 million over the next five years. While builders are used to ups and downs, the most recent bust was extreme in magnitude and duration.
While this can be viewed as a problem, it can also be viewed as a positive since unfettered growth can be somewhat constrained. This does produce an uptick in labor costs, but it appears to be offset for the time being by lower commodity costs.
by admin | Oct 14, 2015 | Market Data
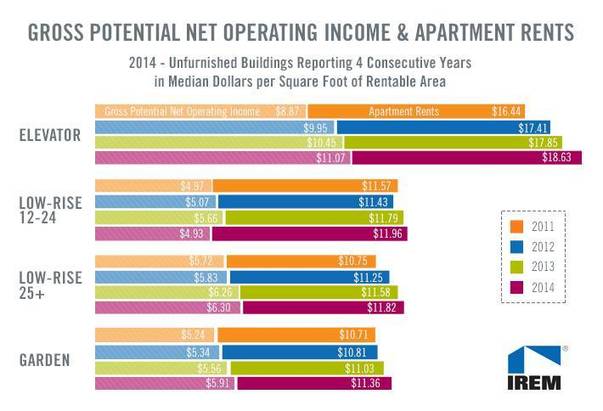
What amenities do you need for your multifamily properties? IREM has the answers.
Source: www.bisnow.com
What types of buildings offer the highest rents? According to IREM data, all four building types reported increases in gross potential apartment rents in 2014. Elevator buildingsreported the highest increase in gross potential rents, 4.4%, raising the rent/SF from $17.85/SF in 2013 to $18.63/SF in 2014. Low-rise buildings with 12 to 24 units increased from $11.79/SF in 2013 to $11.96 in 2014. The rents in garden buildings increased 3% to $11.36/SF, and low-rise buildings with 25 or more units experienced an increase of 2.1%, bringing rents to $11.82/SF.
This chart also reflects the NOI experienced by each building type. (NOI is defined as the income remaining after operating expenses Elevator buildings reported the highest NOI, rising 5.9% to $11.07. Garden buildings reported the greatest increase of 6.3%, from $5.56/SF in 2013 to $5.91/SF in 2014. Low-rise buildings with 12 to 24 units reported the lowest NOI, $4.93/SF in 2014. Low-rise buildings with 25 or more units reported a minimal increase of 0.6% at $6.30/SF in 2014.
The findings mirror the industry’s migration toward more infill projects which typically are more dense and are taller. Rents have risen dramatically in many urban infill areas, however, the pipeline for new construction projects in many of these markets may slow the growth rate and increase occupancies so caution should be exercised in over saturated submarkets.